
Here it is. No form, no email address, no “enter your details to unlock”.
It opens in Excel, in Numbers, and in Google Sheets (File → Import → Upload). Five tabs, and only two of them need anything from you.
What is in it
- Setup — your starting balance, currency and risk per trade. Three cells. Everything else measures against them.
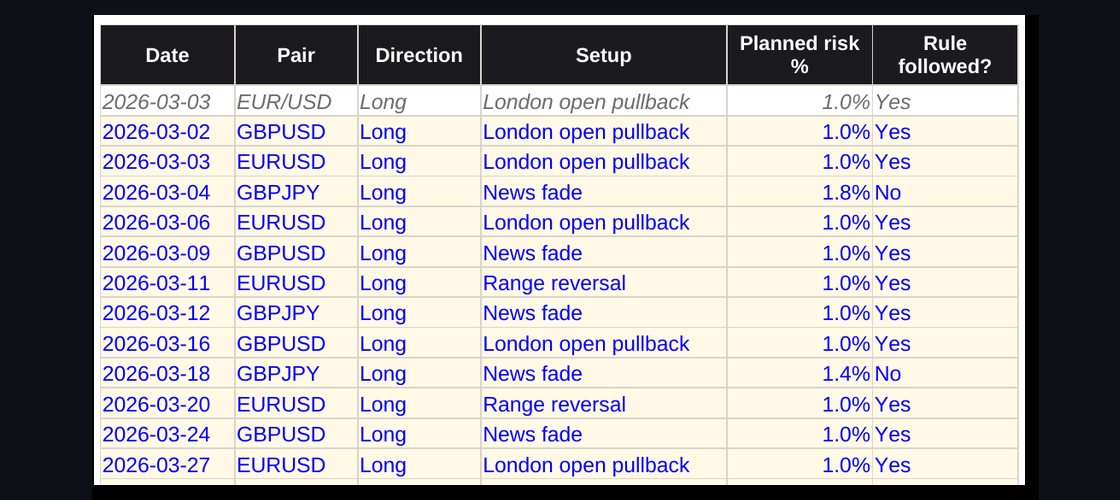
- Trades taken — date, pair, direction, setup, planned risk, whether you followed your rule, your state, and the P&L. Eight columns, about thirty seconds a trade.
- Missed setups — the ones you saw and did not take. Most templates skip this. It is usually the bigger book.
- Monthly review — works itself out. Win rate, average win against average loss, your result split by whether you followed your rules, what hesitation cost, and every setup ranked.
- Read me — one page, in plain English.
It records results in R, not pounds. R is a multiple of what you risked, so a 2R win means you made twice your risk. Currency mixes your edge with your position sizing — a good month with bad discipline looks identical to a good month with good discipline. The template does the conversion for you; you only ever type the pounds.
The one column almost every template leaves out
Missed setups. The trades you identified, planned, and then did not take.
Nobody keeps them, because writing down your own hesitation feels like homework. But they are the honest measure of whether you are executing your system or drifting off it — and in the worked month we published, the skipped setups were worth more than the entire month's trading.
The template totals them for you, in the same R multiples, so the two books are directly comparable.
How to actually use it
- Fill in the Setup tab first. Starting balance and risk per trade. Nothing else works until those are right.
- Log every trade, especially the bad ones. The days you least want to write it down are the days worth recording.
- Name your setups consistently. “London pullback” and “London open pullback” are two different setups to a spreadsheet. Three or four names is plenty.
- Read the Monthly review at month end. Half an hour. Four questions. That is the whole discipline.
When a spreadsheet stops being the right tool
Being straight with you, since this is our template and we also sell an alternative.
A spreadsheet is excellent for the first few months. It is free, it is yours, and it answers the single most valuable question — which setup actually pays — in about ten seconds.
It gets harder when you want to attach charts to trades, when you have three accounts to keep apart, when you want the numbers on your phone, or when you have eighteen months of history and want to know which pattern is costing you money across all of it. At that point the maintenance starts costing more than the insight is worth. That is not a flaw in the template; it is where the format runs out.
I ran Google Sheets for trades and Notion for mistakes for years before building something else. The spreadsheet did not fail me — the admin did.
Try it free for 14 days. No card needed to start.
Common questions
Does it work in Google Sheets?
Yes. File → Import → Upload, then choose “Replace spreadsheet”. Every formula carries across. It works in Apple Numbers too.
Is it really free?
Yes, and there is no email gate. Use it, change it, share it, strip our name off it if you like.
Can I add my own columns?
Add them to the right of the existing ones and nothing breaks. If you insert a column in the middle, check the Monthly review tab afterwards — its formulas point at specific columns.
How many trades does it hold?
Three hundred rows on each log, which is a year or more for most people. Copy the last row down if you need more.
Why R instead of pounds?
Because it lets you compare a month where you risked 1% with a month where you risked 2%. Pounds cannot do that, and most traders change their sizing far more often than they realise.