
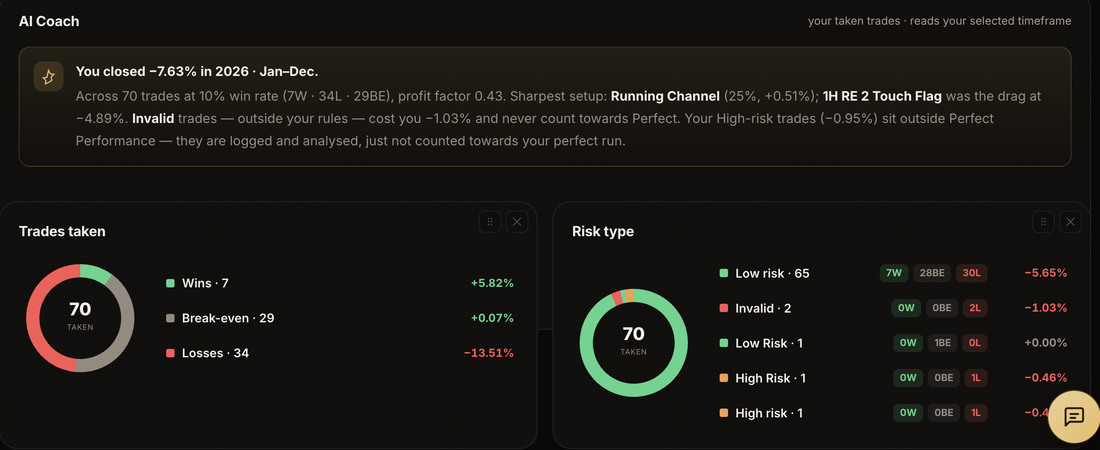
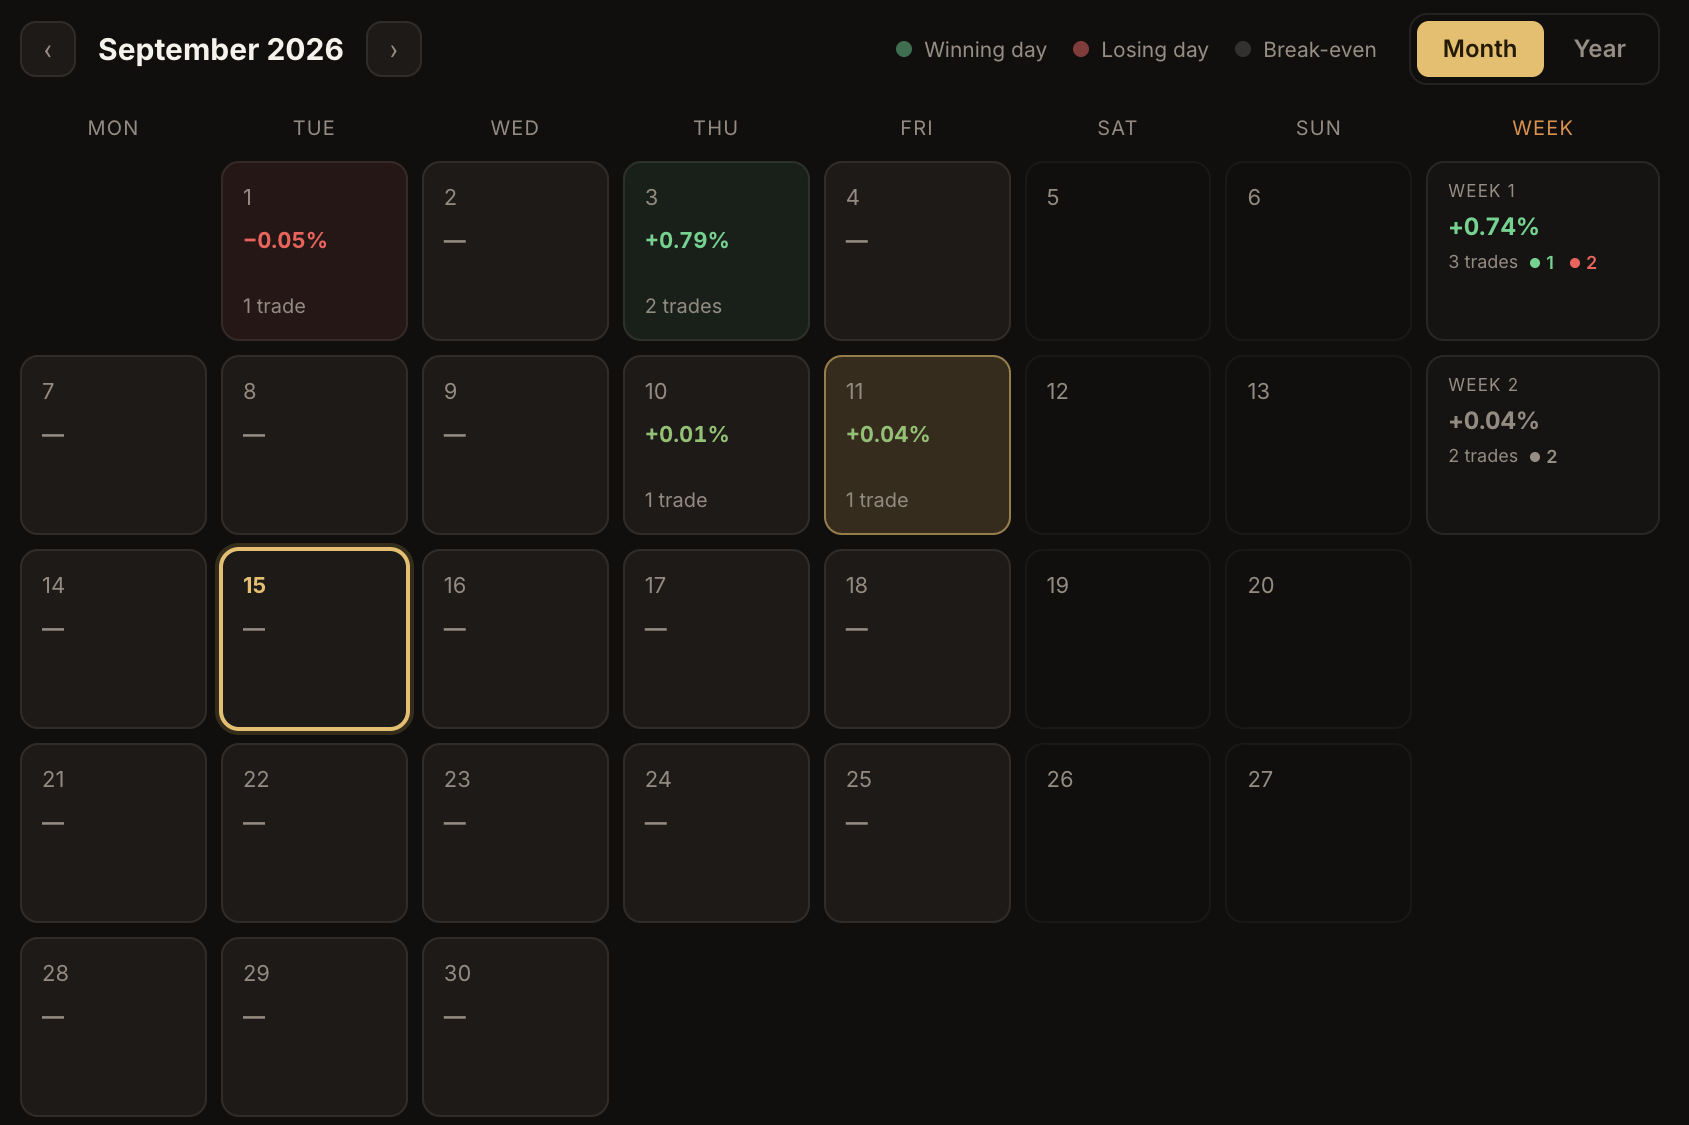
Every chart you saved, on one wall
Wins, losses and missed setups side by side, with their before and after charts. Patterns your memory cannot hold are obvious when the pictures sit next to each other.
TRADES TAKEN · WINS
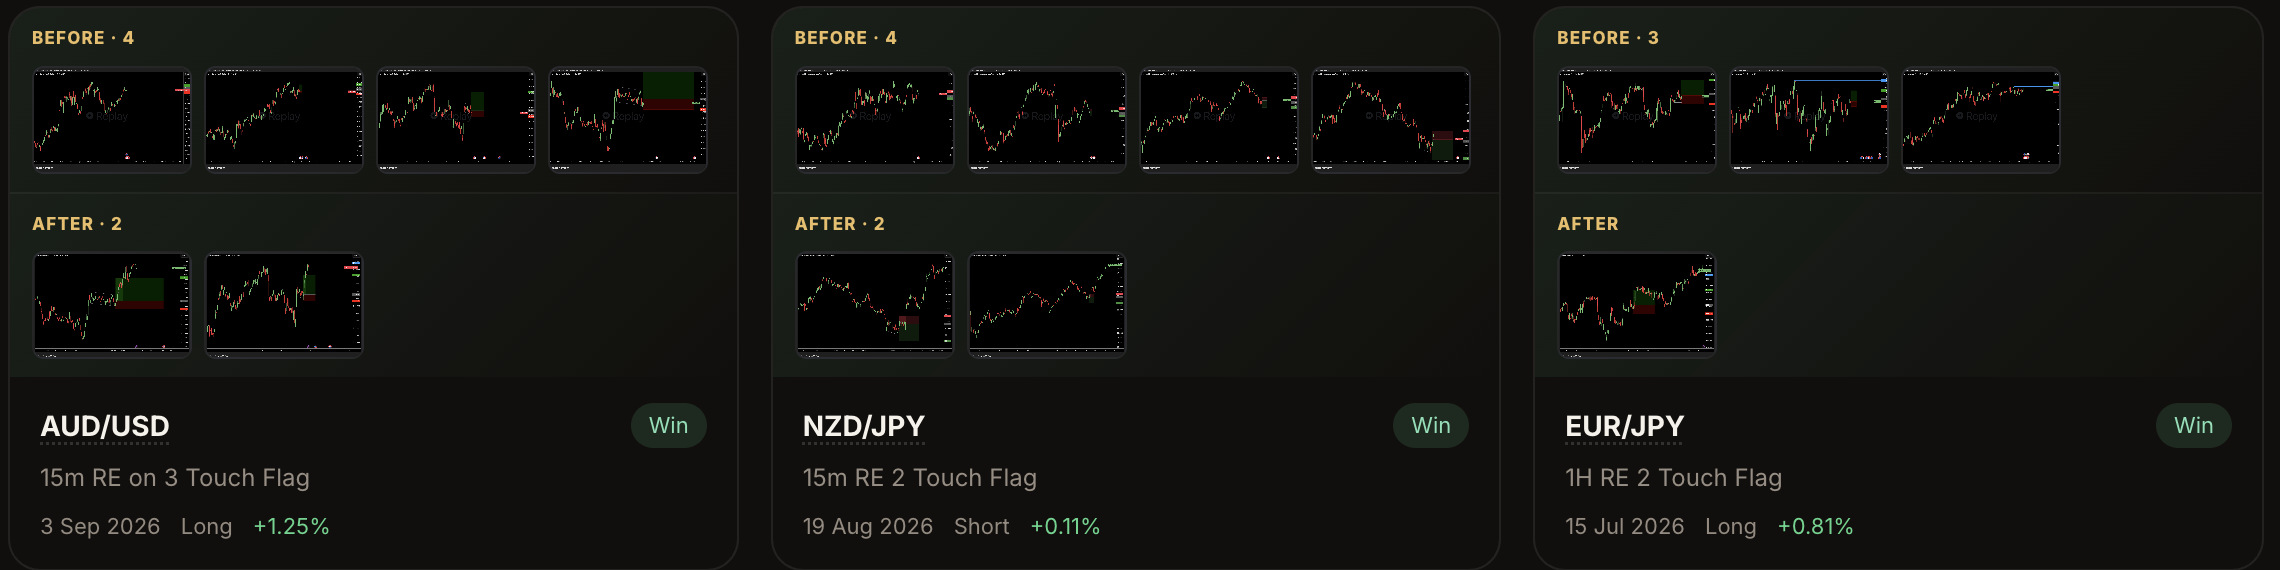
Real cards from a live account. Every entry carries its before and after charts, the setup name, the direction and the result — grouped into wins, losses and missed decks.
The problem
You cannot compare charts you have to remember
Screenshots end up in a folder, a Notion page, or the broker platform you took them in. Finding the last three times you traded this setup means going digging, so nobody does it.
And a chart on its own is half the story — the entry is a decision, and the exit is a different one. Keeping only one of them hides where the trade was actually won or lost.
Put twenty of the same setup on a wall and the thing you keep doing wrong stops being a theory.
How it works
Charts arrive here on their own
Attach when you log
Paste a TradingView link or upload an image on any trade or missed setup, before and after.
Timeframes tag themselves
A TradingView chart link carries its interval, so the chip fills in. A snapshot link does not — click the chip to set it.
Filter the wall
By category, result, type, pair and timeframe. Only entries that actually have a chart appear, so there are no empty cards.
Comparing
Two charts, three months apart
Every card carries its chart, ticker, R-multiple, setup and date — and P&L follows the £ / % toggle like everywhere else.
Use the Both / Before / After switch to focus the wall, and click any thumbnail for the full-size chart.
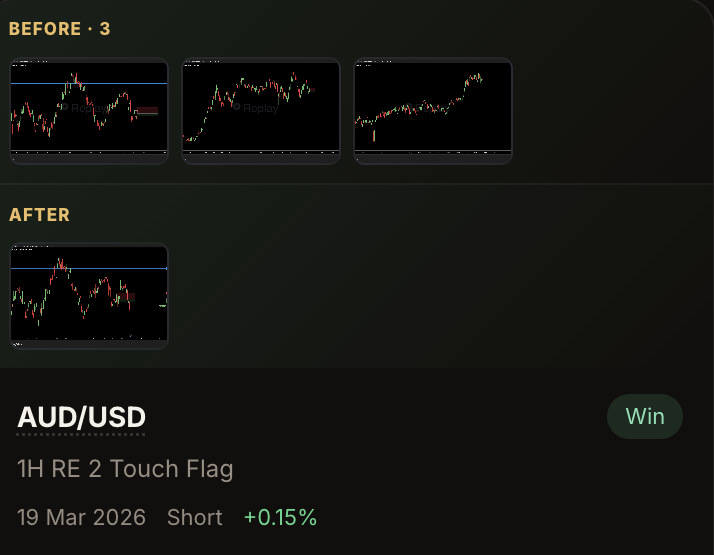
Filter the wall to one setup and the same card appears every time you traded it. Twenty of those side by side is the module. A pattern you would never hold in your head is a glance.
One real card: four charts before the entry, two after, and the trade’s own details underneath.
Straight answers
What it is, and what it isn't
- Collects every before and after chart automatically
- Keeps several timeframes per trade, each with its own label
- Groups wins, losses and missed setups into separate decks
- Reads the timeframe from a TradingView chart link
- Host a charting package — it stores your charts, it does not draw them
- Show entries with no chart attached
- Annotate for you. Your coach can draw on these, you cannot be made to