
The trades you didn’t take have a number too
Log the setup you talked yourself out of, and what it would have made. Hesitation stops being a feeling and becomes a figure you can work on.
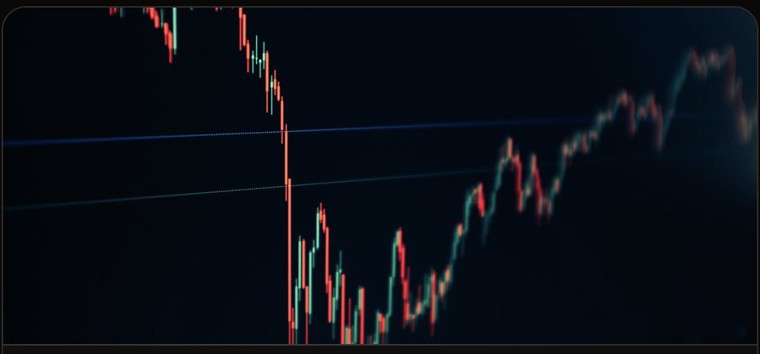
Notes. Same sweep-and-reclaim I took on the 16th. I watched it complete and did not press the button.
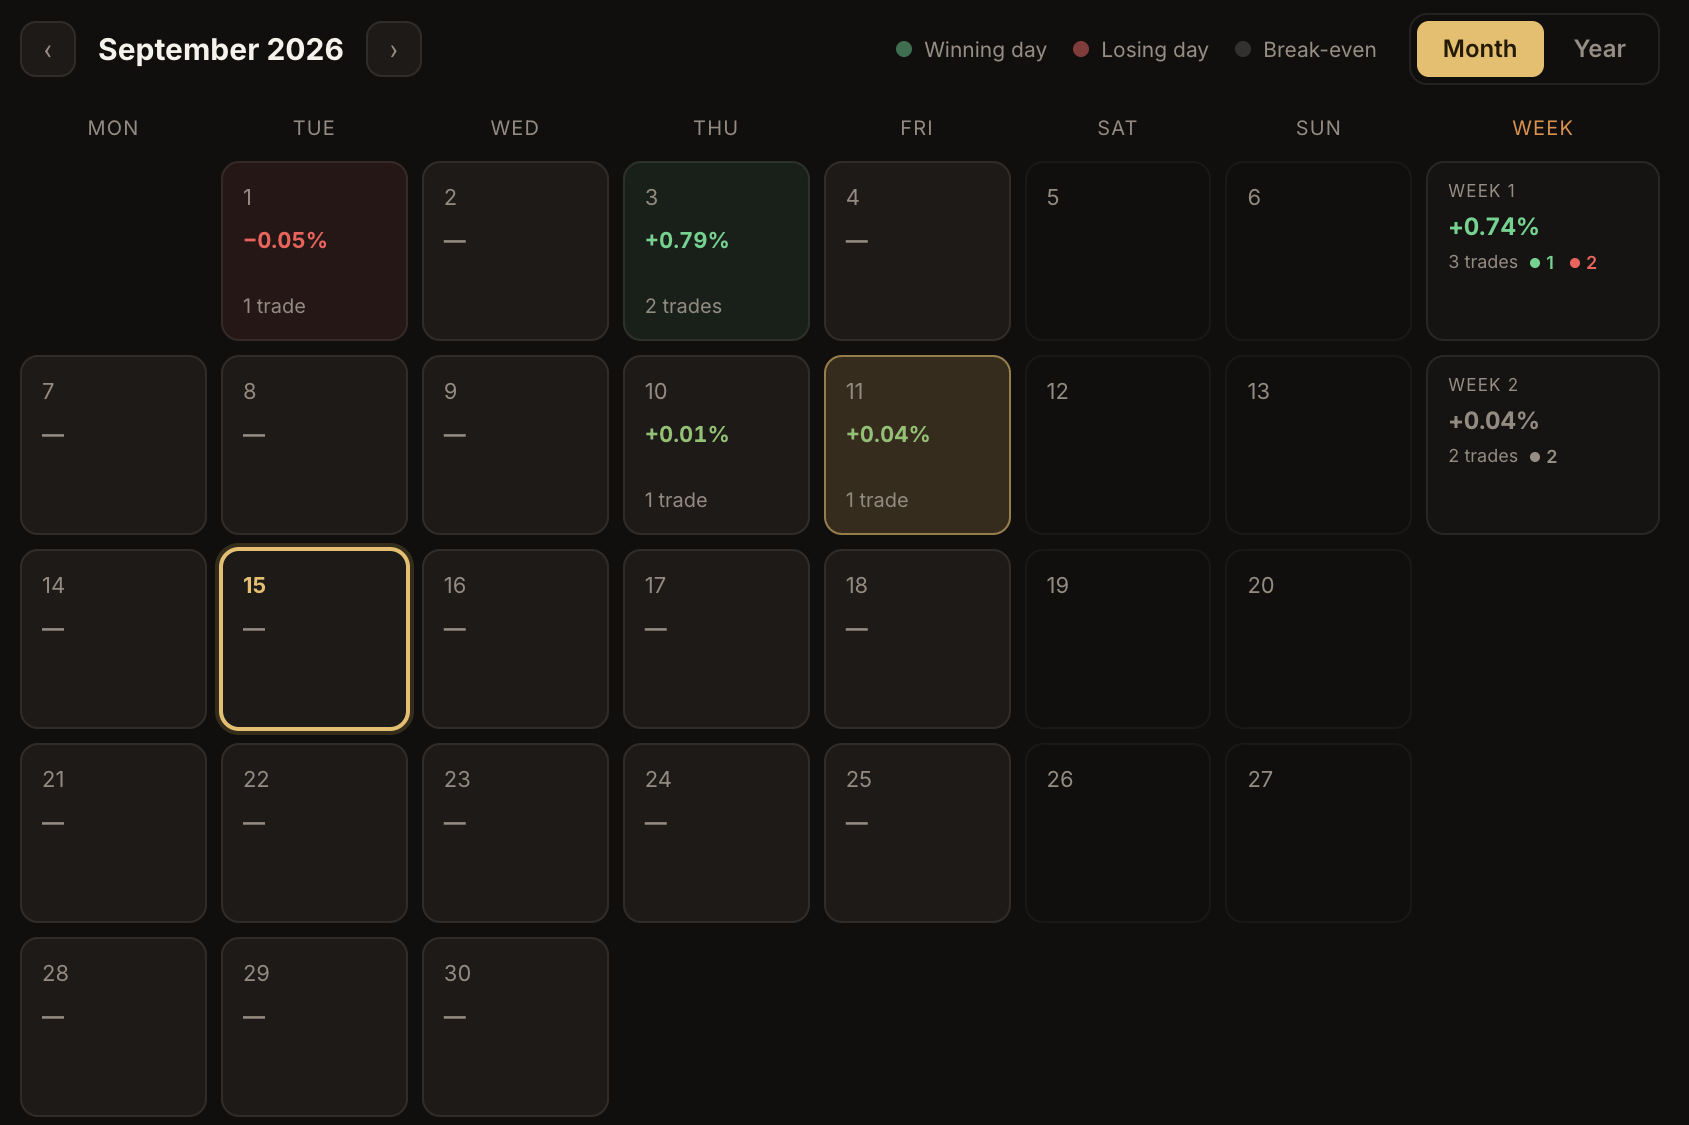
The same month view as the journal, but every figure is what the setup would have made. Click a day to see what each hesitation cost — and a green day is one you were right to skip.
The problem
Every journal records what you did
Almost none record what you nearly did. Yet the setup you watched complete without you is the same setup you take next week — and the reason you skipped it is the thing worth fixing.
Without a record, the miss simply disappears. There is no row for it, no cost attached to it, and nothing to notice when it happens for the ninth time.
So traders end up working on their entries when their real problem is that they were not at the desk, or were already in a trade, or froze.
How it works
Same form, one flag different
Log the miss
Pair, session, risk type, the reason you skipped it, and the P&L it would have made — in £ or %, either way.
Add the chart
Screenshots so you recognise the setup next time. A setup you skipped teaches as much as one you took.
Watch the reasons stack
Filter by reason and the pattern names itself. Yours will probably surprise you.
What it adds up to
One reason usually does most of the damage
Group your misses by why they happened and the list is rarely even. Most traders have one dominant reason carrying most of the cost.
Missed setups also feed the Perfect Performance lens in Analytics — the equity curve of the trader you would be if you had taken the ones that fitted your plan.
| Pair | Date | Session | Reason skipped | Risk type | Would have made |
|---|---|---|---|---|---|
| GBP/JPY | 8 Sep | London | Hesitated at entry | Low risk | £615 |
| EUR/USD | 10 Sep | New York | Already in a trade | Low risk | £210 |
| AUD/USD | 11 Sep | Asia | Not at my desk | Low risk | −£85 |
| USD/CAD | 15 Sep | New York | Hesitated at entry | High risk | £340 |
Hesitation is nine of your twenty-one. It is also your most expensive reason, at £1,410.
The last row is a setup you were right to skip — it would have lost. Those are counted too, or the list only ever flatters the trades you missed.
Your missed-opportunity scoreboard, and every skipped setup with the reason you gave at the time. Filter by reason to see which one costs you most.
Straight answers
What it is, and what it isn't
- Puts a number on hesitation, by reason
- Keeps the chart so you recognise the setup again
- Takes the same notes, lessons and screenshots as a taken trade
- Feeds the Perfect Performance equity curve in Analytics
- Guess what you missed — you log it, so it is honest
- Judge the decision. Some skips are correct, and the log shows those too
- Count towards your real P&L. Missed setups are tracked separately, always