
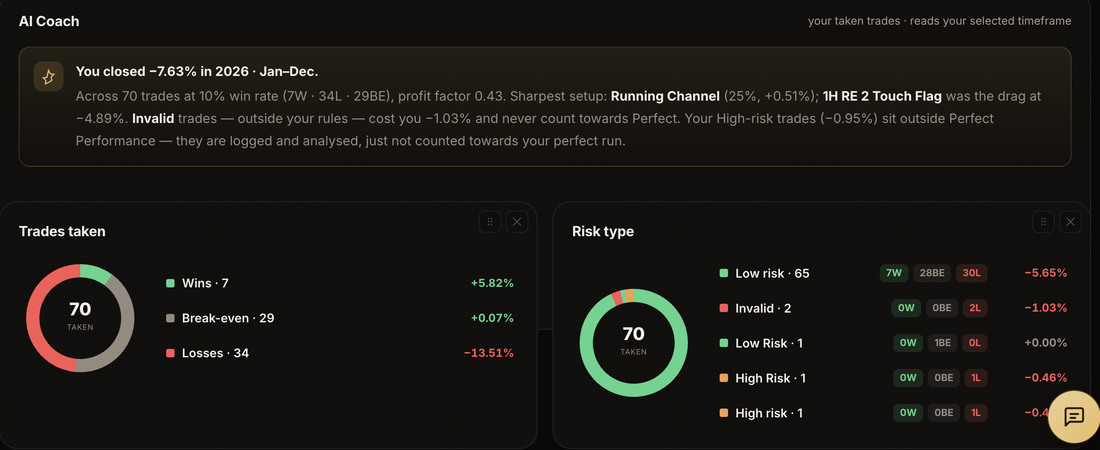

Most articles about trading journals describe one. This is one — a full month, filled in, with the analysis at the end.
The numbers below are a worked example rather than anyone's live account, but the shape is deliberately ordinary: a small positive month, one setup quietly bleeding, and a set of missed trades worth more than the month itself. That combination is extremely common.
The month: twelve trades
| Date | Pair | Setup | Risk | Rule? | State | Result |
|---|---|---|---|---|---|---|
| 2 Mar | GBPUSD | London open pullback | 1.0% | Yes | Calm | -1.0R |
| 3 Mar | EURUSD | London open pullback | 1.0% | Yes | Calm | +2.2R |
| 4 Mar | GBPJPY | News fade | 1.8% | No | Annoyed | -1.0R |
| 6 Mar | EURUSD | London open pullback | 1.0% | Yes | Calm | +1.4R |
| 9 Mar | GBPUSD | News fade | 1.0% | Yes | Rushed | -1.0R |
| 11 Mar | EURUSD | Range reversal | 1.0% | Yes | Calm | +3.1R |
| 12 Mar | GBPJPY | News fade | 1.0% | Yes | Bored | -1.0R |
| 16 Mar | GBPUSD | London open pullback | 1.0% | Yes | Calm | +0.9R |
| 18 Mar | GBPJPY | News fade | 1.4% | No | Annoyed | -1.0R |
| 20 Mar | EURUSD | Range reversal | 1.0% | Yes | Calm | +2.4R |
| 24 Mar | GBPUSD | News fade | 1.0% | Yes | Rushed | -1.0R |
| 27 Mar | EURUSD | London open pullback | 1.0% | Yes | Calm | +1.8R |
Seven columns. That is the whole journal. Note what is not there — no screenshots column, no long notes field, no tags. Those can come later. This much you will actually fill in.
Which setup is actually paying you?
Tap a setup to take it out of the month, and watch what happens to the total. This is the whole reason to group your trades.
All twelve trades. A perfectly ordinary month.
Now the part that matters
The month finished at +5.8R. On 1% risk that is roughly a 5.8% month, which most traders would take. And if you stop reading the record there, you learn nothing.
1. Group by setup
| Setup | Trades | Total | Average |
|---|---|---|---|
| London open pullback | 5 | +5.3R | +1.06R |
| Range reversal | 2 | +5.5R | +2.75R |
| News fade | 5 | -5.0R | -1.00R |
Five news fades, five losses. Not one worked. That setup contributed nothing but risk, took up 42% of the month's trades, and the profitable month hid it completely. A trader looking only at their balance would have carried it into April.
2. Split by rule followed
Ten trades followed the rules and returned +7.8R. Two didn't, and cost -2.0R. Both broken-rule trades were oversized, both were news fades, and both are marked annoyed.
That is not a strategy problem. That is a specific, nameable behaviour: after a loss, this trader takes a bigger position in their worst setup. You cannot see that in a broker statement. It falls straight out of a journal with a state column.
3. The book that isn't in the table
The five setups seen and not taken:
| Date | Setup seen | Why it wasn't taken | What it would have done |
|---|---|---|---|
| 5 Mar | London open pullback | Still annoyed about the 4th | +2.0R |
| 10 Mar | Range reversal | Wasn't at the screen | +1.6R |
| 13 Mar | London open pullback | “Didn't feel right” | +2.3R |
| 19 Mar | London open pullback | Down for the week, playing safe | -1.0R |
| 25 Mar | Range reversal | Hesitated, missed the entry | +1.9R |
+6.8R left on the table. More than the month made. And the one skipped trade that would have lost was skipped for a good reason, while three of the four winners were skipped for emotional ones.
So the honest summary of this month is not “up 5.8R.” It is: a trader with two working setups, one that should be deleted, a sizing problem after losses, and hesitation costing more than the strategy earns. Same month, entirely different conclusion.
The three actions this month generates. Stop trading news fades for 30 days and log them on paper instead. Cap risk at 1% with no exceptions after a losing day. Take every valid London open pullback for a month, whatever the week looks like. Three concrete changes, from twelve rows and half an hour.
Copy this structure
If you want to start tonight, use exactly the seven columns above — date, pair, setup, planned risk, rule followed, state, result in R — plus a second sheet with four columns for the setups you skipped. Nothing else. You can add to it once you have three months of data and an actual question to ask of it.
The two things people leave out are the state column, because it feels unscientific, and the missed trades sheet, because it feels like admin. Those are the two that produced every insight above.
Exhibit A does this automatically — the grouping, the rule-followed split and the missed-trade log are built in, and an AI coach writes the monthly review off your own numbers. If you'd rather understand the theory first, start with what a trading journal actually is.
Try it free for 14 days. No card needed to start.
Common questions
How many trades before a journal tells me anything?
Setup-level patterns start showing at about 20–30 trades per setup. Behavioural patterns — sizing after losses, day-of-week effects — often show up in the first month, because they repeat far more reliably than edges do.
Should I record results in currency or R?
R, always. Currency mixes your edge with your sizing, so a good month with bad discipline looks identical to a good month with good discipline.
Isn't recording missed trades just self-punishment?
Only if you record them and never total them. Done properly it is a measurement: in the month above it converts a vague feeling of hesitancy into “6.8R, mostly on Tuesdays after a loss”, which is something you can act on.