
Your edges and your leaks, named
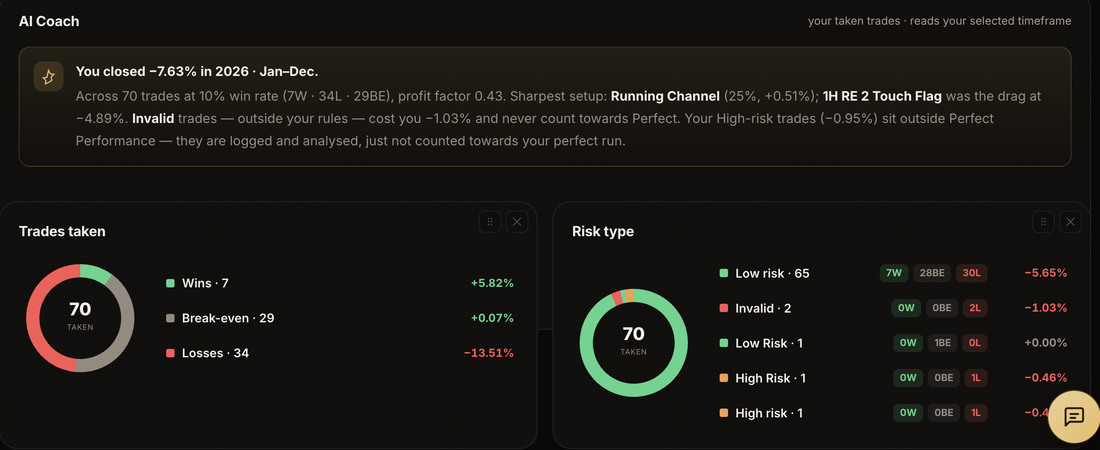
Every chart is derived live from what you logged — no upkeep, ever. And an AI Coach that reads your own trades back to you in plain English, rather than leaving you to interpret a wall of charts.
— AI Coach
Your edge is the London sweep, and your leak is Friday. Sweep-and-reclaim is 71% across 31 trades; everything you have taken after 2pm on a Friday is net negative. One change: stop trading Friday afternoons.
Read from your P&L, win rate, best and worst day, long vs short and your emotional tags.
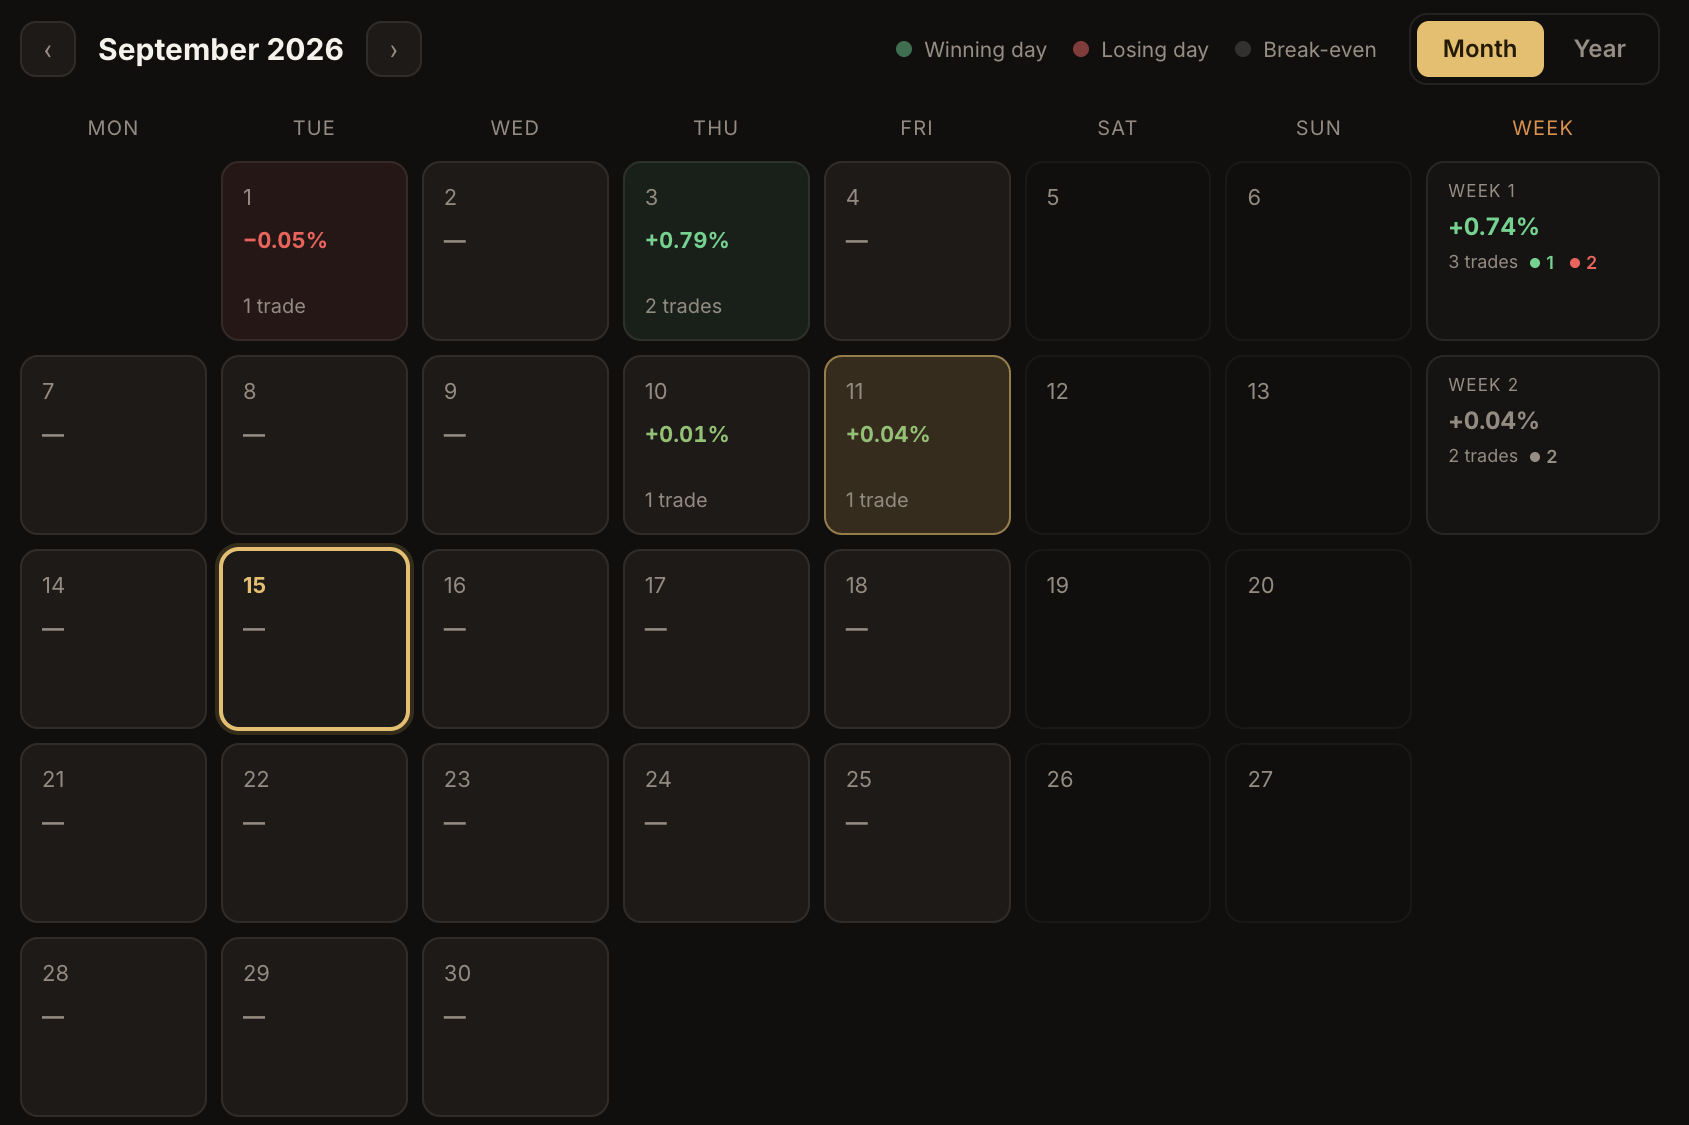
Four lenses over the same year. The AI Coach reads across your P&L, win rate, best and worst day, long versus short, and your emotional tags.
The problem
Most analytics tell you what happened
Win rate, profit factor, expectancy — all correct, all necessary, and none of them tells you what to do differently on Monday.
Worse, the numbers only cover the trades you took. A journal that never sees the setups you skipped is flattering you — it cannot show you the version of your year where you took them.
And the honest questions are rarely on the dashboard: which session actually pays, whether your high-risk trades earn their risk, and what your mood on the day is worth in money.
How it works
Four lenses over the same year
Trades Taken
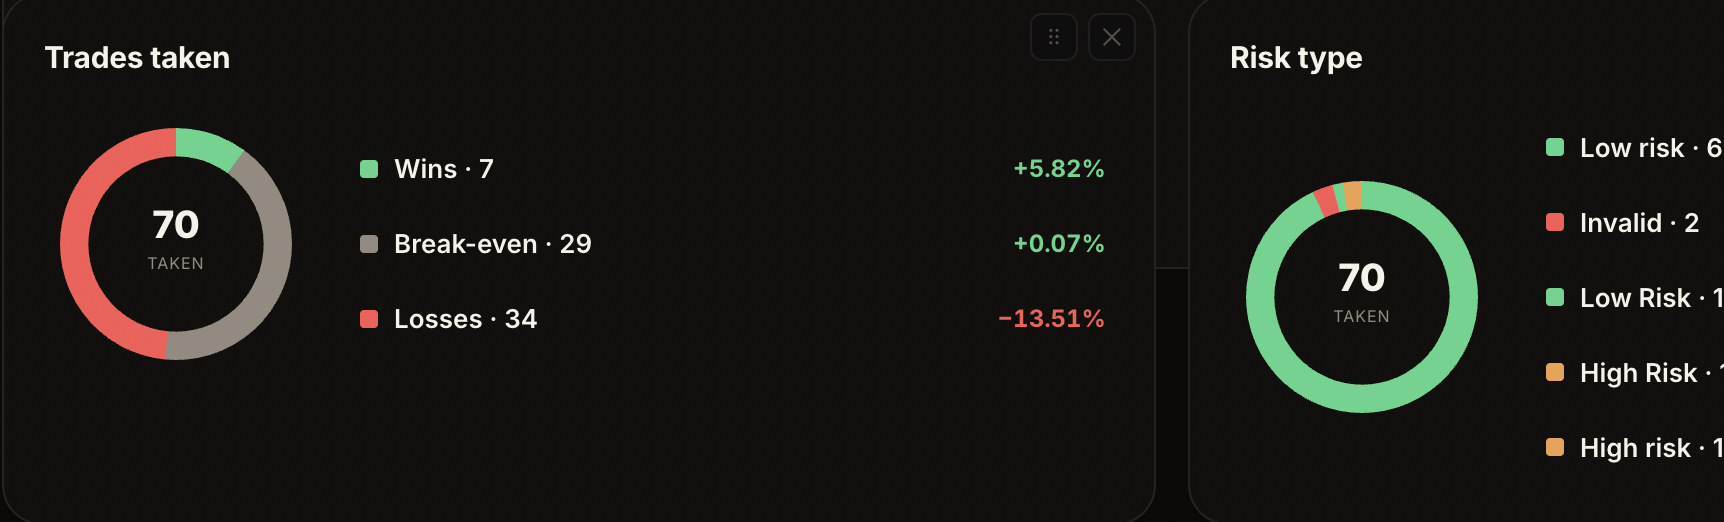
Net P&L, win rate, profit factor, expectancy and average win/loss — with a pie for how your trades split across Low, High and Invalid risk.
Perfect Performance
Taken, missed and Other combined into one scoreboard, filtered to the risk types you said count. Includes the you-versus-perfect equity curve.
Missed & Psychology
Profit left on the table and potential win rate; then discipline score, your most profitable and costliest mood, and average P&L by mood.
Slicing it
Widgets you arrange, breakdowns you regroup
Switch a breakdown between By Pair, Session, Day, Month and Direction. Direction and Session draw as pies; pair, day and month stay as bars. Ten items show at once and an arrow scrolls the rest.
The £ / % toggle follows you into the legends, so each slice swaps between its share of trades and the net P&L behind it.
Fair — and rising
Trading frequency is deliberately not scored — sitting out when nothing sets up is discipline, not absence of it.
The real Trades taken and Risk type widgets from a live account, and the Edge score underneath. Every widget on the page can be closed or dragged into the order you want.
Straight answers
What it is, and what it isn't
- Derives every chart live from what you logged
- Counts the setups you missed, not just the ones you took
- Names your strongest edge and your costliest habit in plain English
- Scores discipline separately from profit
- Predict the market, or tell you what to trade next
- Score you for trading less — frequency is deliberately not measured
- Need any manual upkeep or a separate spreadsheet
- Count high-risk trades as undisciplined if high risk is in your plan